In the evolving landscape of Indian fashion retail, the ability to transition from intuition-based management to data-driven decision-making is a significant competitive advantage. For many boutique owners, "growth" is often felt through a busy shop floor rather than seen through structured data. However, as a business scales, relying on memory or manual registers becomes unsustainable. Utilizing a dedicated boutique app allows owners to generate and interpret growth reports that provide a clear roadmap for the future. These reports don't just record what happened; they explain why it happened and how to replicate success.
How do growth reports help a boutique business?
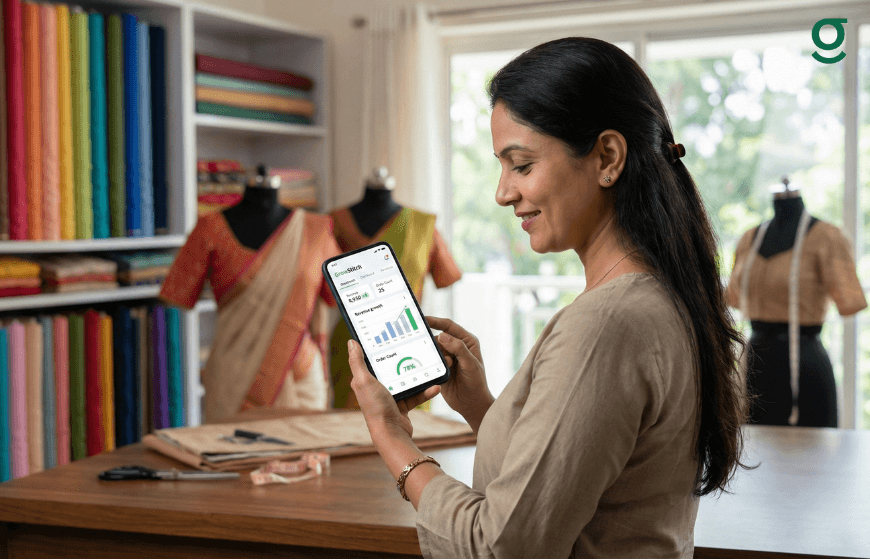
Growth reports in a boutique app help by consolidating sales, customer, and production data into visual dashboards. They allow owners to track "Year-on-Year" revenue, monitor the Average Order Value (AOV), and compare actual performance against pre-set store targets. By providing visibility into which products are trending and how the business ranks against local competition, these reports enable smarter inventory planning and more effective resource allocation.

The Intelligence Layer: Moving from Manual Records to Automated Growth Reports
The traditional method of boutique management involves a "Measurement Book" and a "Cash Book." While these serve as a record of transactions, they lack an intelligence layer. Information is trapped on paper, making it nearly impossible to calculate growth percentages or identify seasonal patterns without hours of manual calculation.
A modern tailoring app introduces automation to this process. Every time an order is created whether it is for a bridal lehenga or a simple blouse the boutique app automatically updates your financial and operational metrics. This automation eliminates human error and ensures that the data you are interpreting is accurate and up-to-date. Instead of looking back at the end of the month, owners can access real-time growth reports that show exactly where the business stands at any given moment.
Key Metrics to Track: Understanding Total Sales, Targets, and AOV
To interpret a growth report effectively, an owner must focus on three core metrics provided by a professional boutique application:
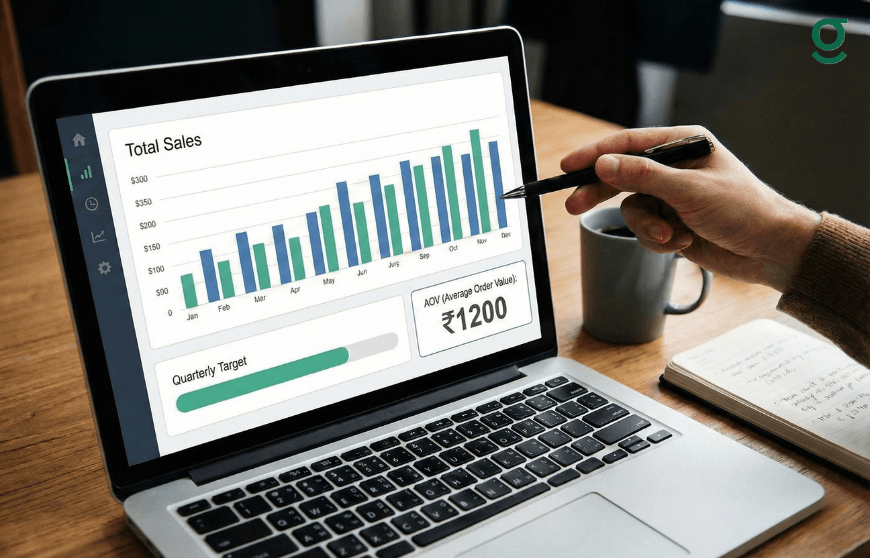
- Total Sales: This is the cumulative revenue generated. However, total sales alone don't tell the whole story. A growth report compares this figure to previous months to show the trajectory of the business.
- Store Targets: Within the GrowStitch dashboard, the first step is often to "set store targets." A growth report tracks your progress toward this goal. If your target is ₹2,00,000 and the report shows you are at ₹1,50,000 with only five days left in the month, you know exactly how much more effort is required.
- Average Order Value (AOV): The AOV tells you the average amount a customer spends per visit. In many Indian boutiques, the AOV might be set around ₹1,500. If your growth report shows the AOV is increasing, it indicates that your upselling strategies such as recommending premium linings or embroidery are working.
| Metric | Purpose | Growth Indicator |
|---|---|---|
| Current Month Sales | Tracks total revenue. | Higher than the previous month/year. |
| Set Store Target | Sets a financial benchmark. | Percentage of target achieved. |
| Average Order Value | Measures customer spend. | Increase in per-customer revenue. |
Deciphering Growth Insights: Benchmarking Your Boutique Against Local Competition
One of the most innovative features of a specialized tailoring app is the ability to look beyond your own four walls. The "Growth Insight" feature provides a market comparison that was previously unavailable to small business owners.
By using a boutique app, you can see how your business ranks within your specific pin code and city. This report might list the "Top Three Selling Products" in your area. For example, if the report shows that "Gowns" are the top-selling item in your pin code, but your boutique primarily focuses on "Salwar Suits," there is a clear opportunity for expansion. Interpreting these insights allows you to align your offerings with local market demand, ensuring that your growth is in sync with industry trends.
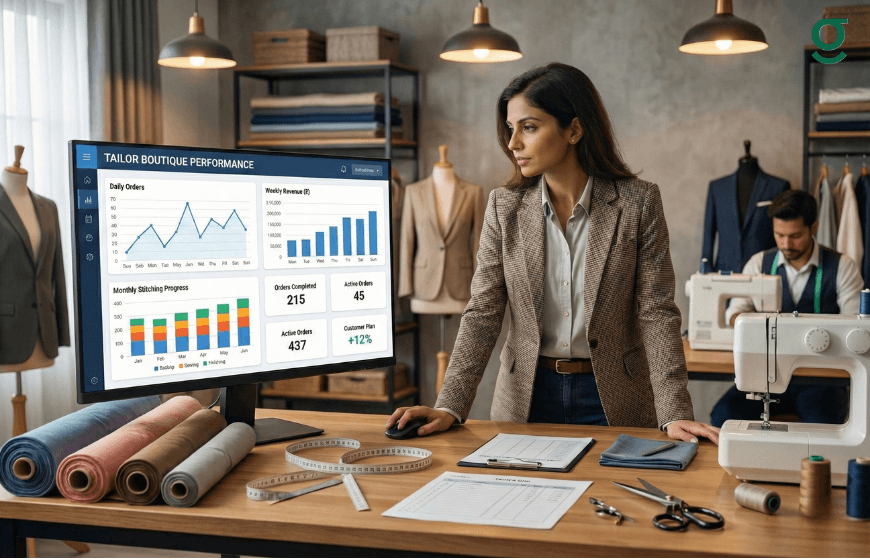
Time-Based Performance Analysis: Evaluating Daily, Weekly, and Monthly Trends
Growth is rarely a straight line; it fluctuates based on the day of the week and the season. A boutique app allows for granular time-based analysis.
- Daily Trends: Helps in managing daily cash flow and identifying if certain days (like weekends) require more staff on the floor.
- Weekly Trends: Useful for monitoring the progress of orders through production stages like stitching and finishing.
- Monthly Trends: The primary tool for strategic planning. It helps in evaluating the success of monthly marketing efforts or seasonal collections.
By toggling between "Today," "Yesterday," "Last 7 Days," and "Last Month" in your tailoring app, you can identify "slow periods." If the data shows a consistent dip in the second week of every month, you can plan promotions or staff training during those specific windows to maintain productivity.
From Data to Strategy: Using Production and Sales Reports to Scale Your Business!
The ultimate goal of interpreting growth reports in a boutique app is to turn data into a scaling strategy. Scaling "smart" means growing without losing control of your quality or delivery timelines.
For instance, if your sales reports show a 30% increase in orders, you must check your "Production Insight" to see if your team can handle the load. If the report shows that the "stitching" stage is consistently delayed, adding more sales will only lead to customer dissatisfaction. In this case, the data-driven strategy would be to hire another master or tailor before further expanding your customer base.
Furthermore, by analyzing geographic performance insights, you can see if your growth is coming from local walk-ins or overseas customers. This allows you to tailor your service perhaps by offering more "Express Delivery" options for local clients or focusing on virtual measurement sessions for international ones.
Conclusion
Generating and interpreting growth reports is a fundamental shift in how a boutique is managed. By utilizing a boutique app, owners move away from the "silent" data of manual registers and into a world of "active" intelligence. Whether it is tracking AOV, monitoring store targets, or benchmarking against the local market, the insights provided by a tailoring app ensure that every decision is backed by facts. As the GrowStitch philosophy suggests, the path to success is to "Start simple and Scale smart," using data as the compass for your journey in the fashion industry.
And if you move now, the first 1,000 users get exclusive early-bird access, download the app today and stay ahead while others struggle to catch up
Frequently Asked Questions
1. How do I start generating growth reports in the boutique app?
The process starts with data entry. As you import contacts and create digital orders, the boutique application automatically begins compiling this data into visual reports on your dashboard. Setting a "Store Target" is the first active step to tracking growth.
2. Can I see which of my tailoring services is the most profitable?
Yes. By reviewing your sales reports and Average Order Value (AOV) for different categories (like blouses vs. lehengas), you can identify which services contribute most to your revenue and focus your marketing efforts there.
3. Does the tailoring app show me how I rank against other boutiques?
Through the "Growth Insight" feature, the app shows your rank within your specific pin code and city based on platform data. It also highlights the top-selling products in your area to help you stay competitive.
4. How can I use these reports to manage my team?
The "Production Insight" report allows you to track orders through stages like stitching, hemming, and finishing. If the reports show a bottleneck in a specific stage, you can reassign team members or adjust your workflow to improve efficiency.
5. Can I track the growth of my overseas orders separately?
Yes. A professional boutique app provides geographic performance insights, allowing you to see exactly how much revenue is coming from India versus international clients, which is essential for boutiques with a global reach.
6. What is the benefit of tracking AOV in a tailoring business?
Tracking Average Order Value helps you understand if you are successfully upselling. If your AOV is low, it might be time to encourage your staff to suggest add-ons like premium embroidery, buttons, or faster delivery options during the order creation process.